What is Standard Deviation?
- Soham Shinde
- Jul 9, 2021
- 2 min read
Updated: Jul 10, 2021
Standard deviation is next important concept while dealing with data. In this blog, I will explain the meaning of standard deviation and how it is used to find the insights from data. I will explain what does the standard deviation explains in real life. This blog will contain:
Definition of standard deviation
Example of standard deviation
Formula of standard deviation
Application of standard deviation
Definition of Standard Deviation:
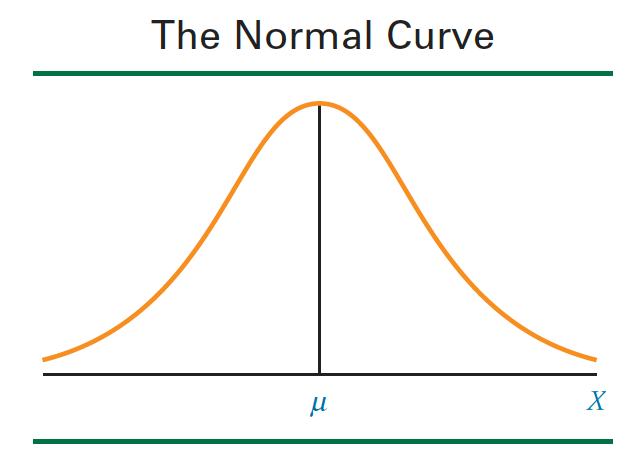
Standard deviation is defined as the distance from the mean of any given point. Standard denotes that it is standard distance or deviation. In every data, we can find the point by how far (Number of standard deviations) is it from mean.
Basically it tells, how far is the point on the distribution (Normal Distribution) from the mean.
Example:
Let's take an example and try to understand the meaning of Standard deviation.
If we have a data of satisfaction rate of 15 people who shipped the package from our logistics company from 1 to 100.
Satisfaction rate = [ 88, 92, 72, 48, 40, 77, 52, 20, 8, 55, 77, 12, 22, 57, 92 ]
Formula:
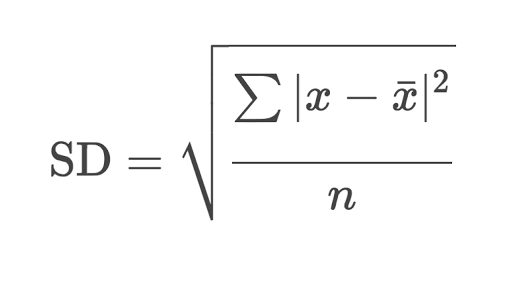
The above formula is used to find the standard deviation. Where,
SD = Standard Deviation
x = Value in dataset that we are interested in, to find how far is it.
_
x = Mean of the dataset
n = Number of values in the data/ Number of samples
Finding the standard deviation for above dataset:
If we want to find the standard deviation, we have to subtract mean value from each value in data and then take absolute value. This makes all values positive. Then, we have to square the absolute values that we found. After this step, take sum of all the absolute values and we have to divide the sum by number of samples taken. In this case we have 15 data points.
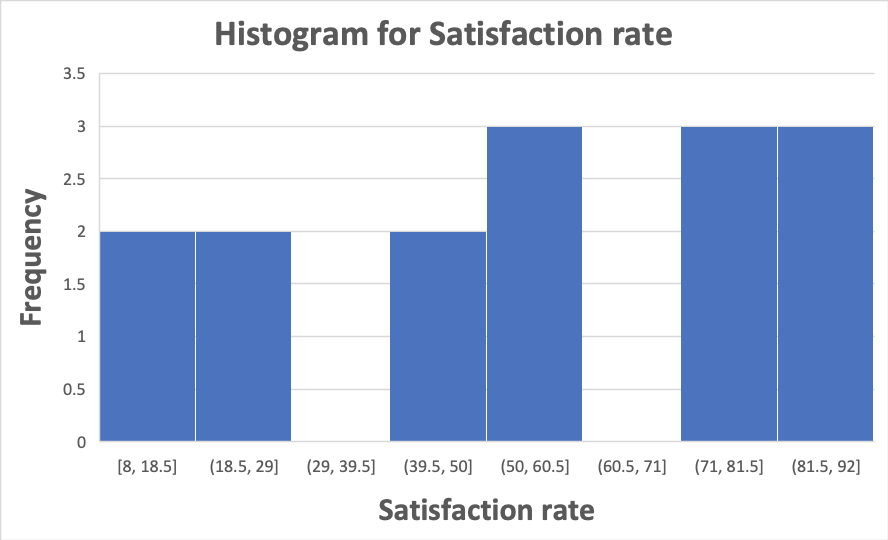
I have taken these values of satisfaction rate in Excel and founded the standard deviation which is 27.97 for this dataset. This value tells us that the deviation from the mean is 27.97. I have plotted a histogram in MS Excel to show how is is distributed. We can find the deviation from the mean, that tells how much standard deviation is the value from the mean.

Plotted on Histogram:
The number of bins matter a lot in histogram. So, you have to be careful while selecting the number of bins. Also, in below Histogram we can see that most of the people have rated in 39 to 60 and 71 to 92 for satisfaction rate.
Application of Standard Deviation:
Standard deviation is calculated at starting of the analysis to get an idea of the data. Most of the time, we can infer whether the data point is outside of 3 standard deviation from mean, then we conclude that datapoint as outlier. This is mainly used in finding the outliers.
For outliers, I will explain the concept in the next topic.
Thank you for reading my blog! If you like my blogs, please subscribe to my blog by creating account.
Soham S Shinde


Comments