Normal Distribution: Most Widely Used Distribution
- Soham Shinde
- Jul 15, 2021
- 2 min read
Hello, this blog will explain the basic and most widely used distribution while dealing with data- NORMAL DISTRIBUTION. The main reason is because that fits the most human and natural characteristics. For example, the heights of whole population of the World, weight, speed, IQ, and in nature, trees, animals, insects have many characteristics that are normally distributed.
Many business terms are also normally distributed. We can say that, the cost of renting warehouse space, manager's satisfaction on the scale of 5, customers satisfaction rate for company.
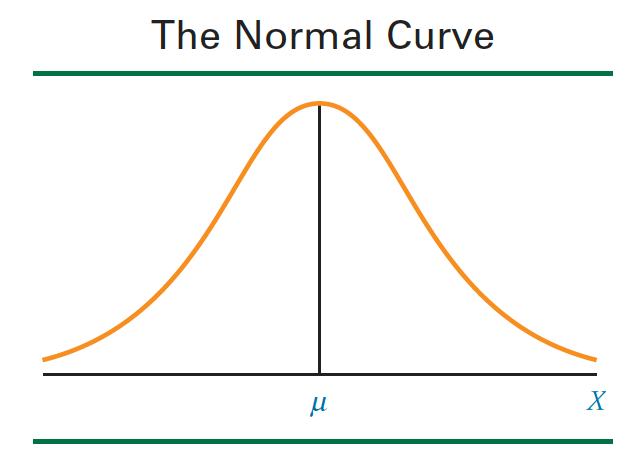
Figure: Normal Curve/ Bell Shaped Curve
Discovery of Normal Distribution:
Founded by mathematician and astronomer Karl Gauss (1777-1855), who recognised that errors of repeated measurements of objects are normally distributed. Thus normal distribution is also referred as Gaussian Distribution or Normal curve of error or Bell shaped curve.
While dealing with the normal distribution, we have to keep in mind that, it has some characteristics:
It is continuous
It is symmetric about mean
It tries to get close to x-axis, but does not touch the axis. (Asymptotic)
It has only one mode (Unimodal)
It is family of curves
Always area under curve is 1
Important Note:
Normal distribution is the family of curve. Every unique mean value and standard deviation has different curve shape.
Formula:
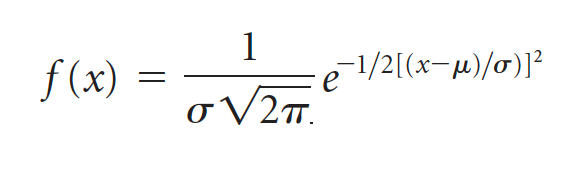
where,
u = mean of x
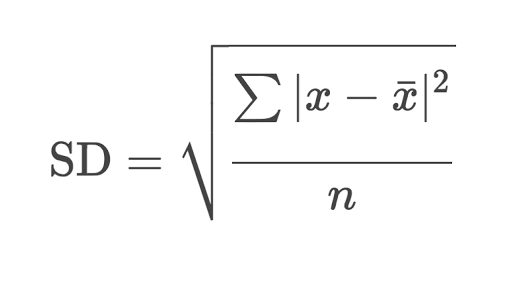
sigma = standard deviation of x
Pi = 3.14159
e = 2.718
Different Curves based on Mean and Standard Deviation:
As we discussed earlier that normal distribution is family of curves. In this section, we will see how it depends on standard deviation and mean.
For mean = 10 and standard deviation = 1:
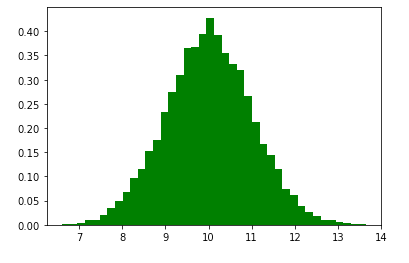
Figure: Histogram of Mean = 10 and Std Dev = 1
We can see in the histogram above that normal distribution is spread across the mean of 10 and standard deviation of 1. We can see that the green histogram has thin spread. The histogram is not spread widely.
The values between 9 to 11 are 68% values of whole data.
The values between 8 to 12 are 95% values of whole data.
The values between 7 to 13 are 99.7% values of whole data.
The 68-95-99.7 rule are valid for any histogram that we plot.
2. For mean = 10 and standard deviation = 10:
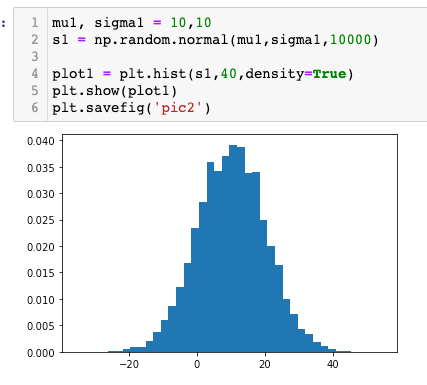
Figure: Histogram of Mean = 10 and Std Dev = 10
If we compare the above green histogram with the red histogram. We can see that red histogram is widely spread around the mean of 10. This is because of the standard deviation. The standard deviation decides the spread of the histogram, and tells us how the data has been spread on the distribution. Mean tells us the position of the histogram on the distribution.
Take away from blog:
Normal distribution is symmetric
Always the area under the curve is 1
64% of values are between 1 standard deviation from mean
95% of values are between 2 standard deviations from mean
99.7% of values are between 3 standard deviations from mean
Standard deviation decides the shape of curve or spread
Mean decides the position of the curve. Highest point in curve is the mean.
Thank you for your time!
Soham S Shinde
Note: The blog is written by me and not copied from anywhere.


Comments